

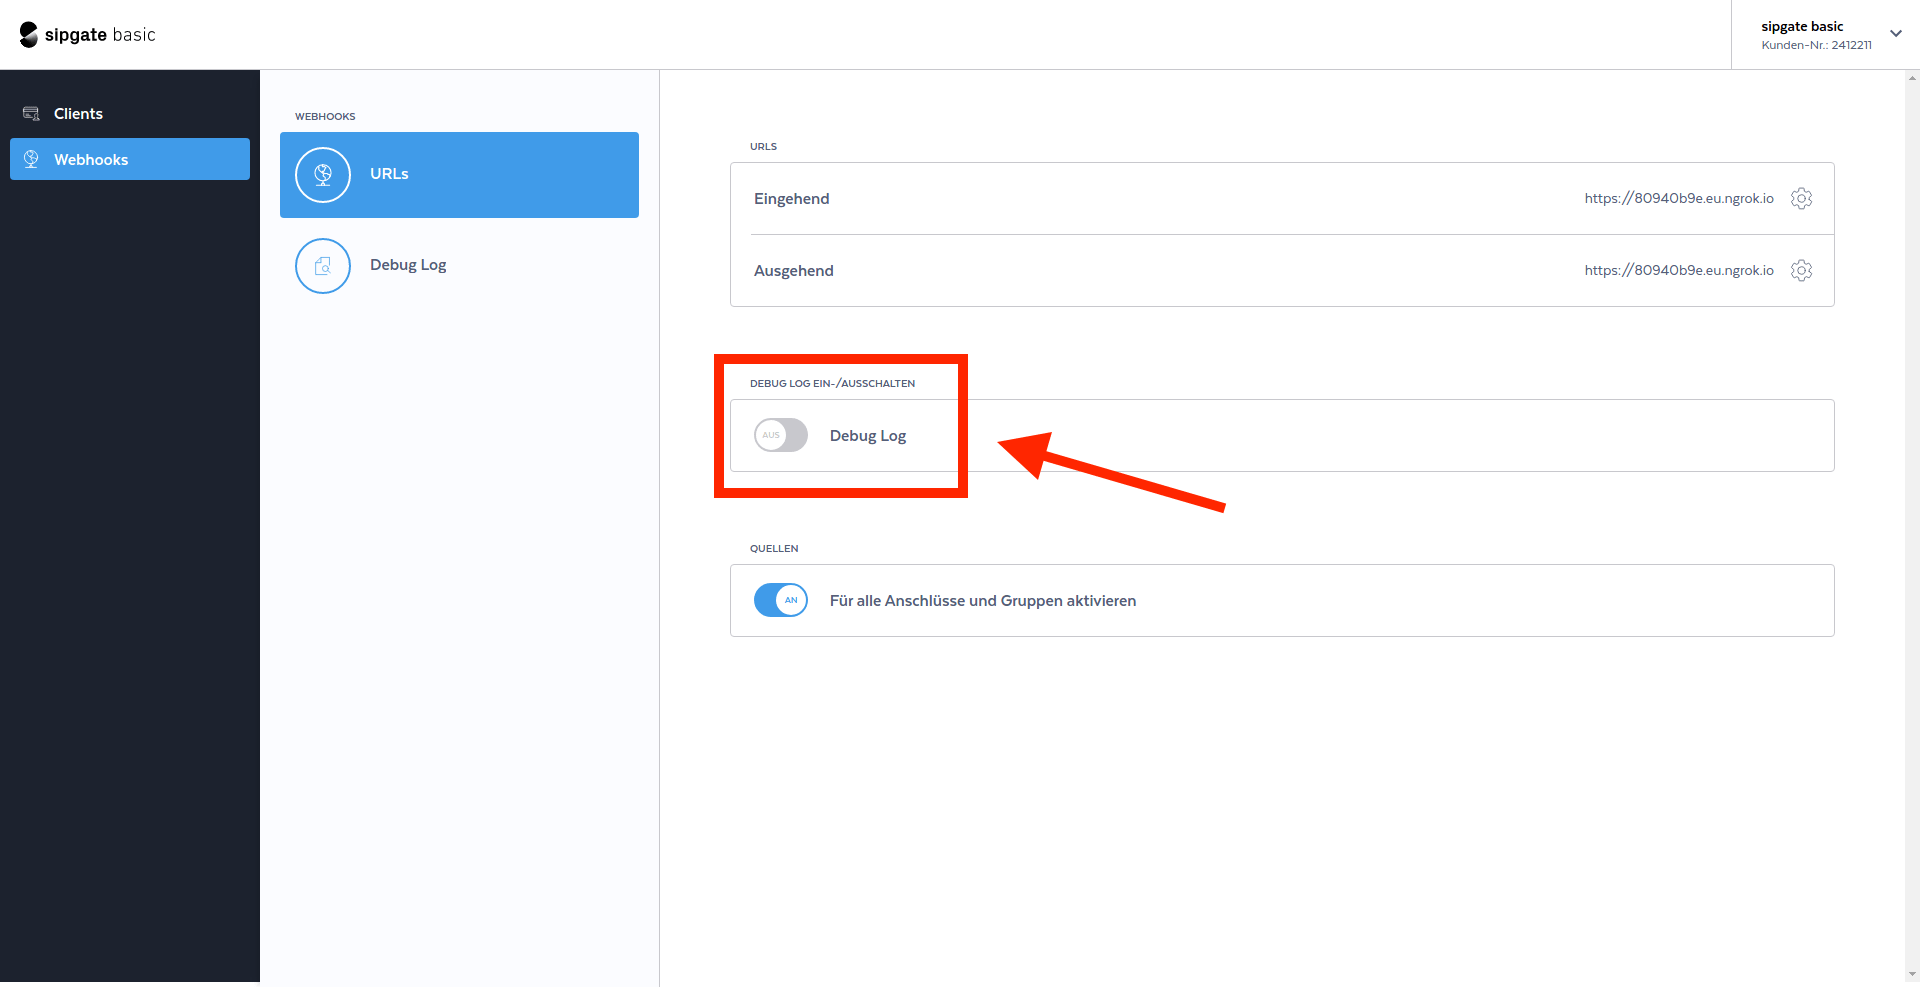
Enable debug log
You can enable logging for debugging purposes from your webhooks dashboard. You will find each request and the corresponding response in the logging table.
1. Click on „Activate debug log“.
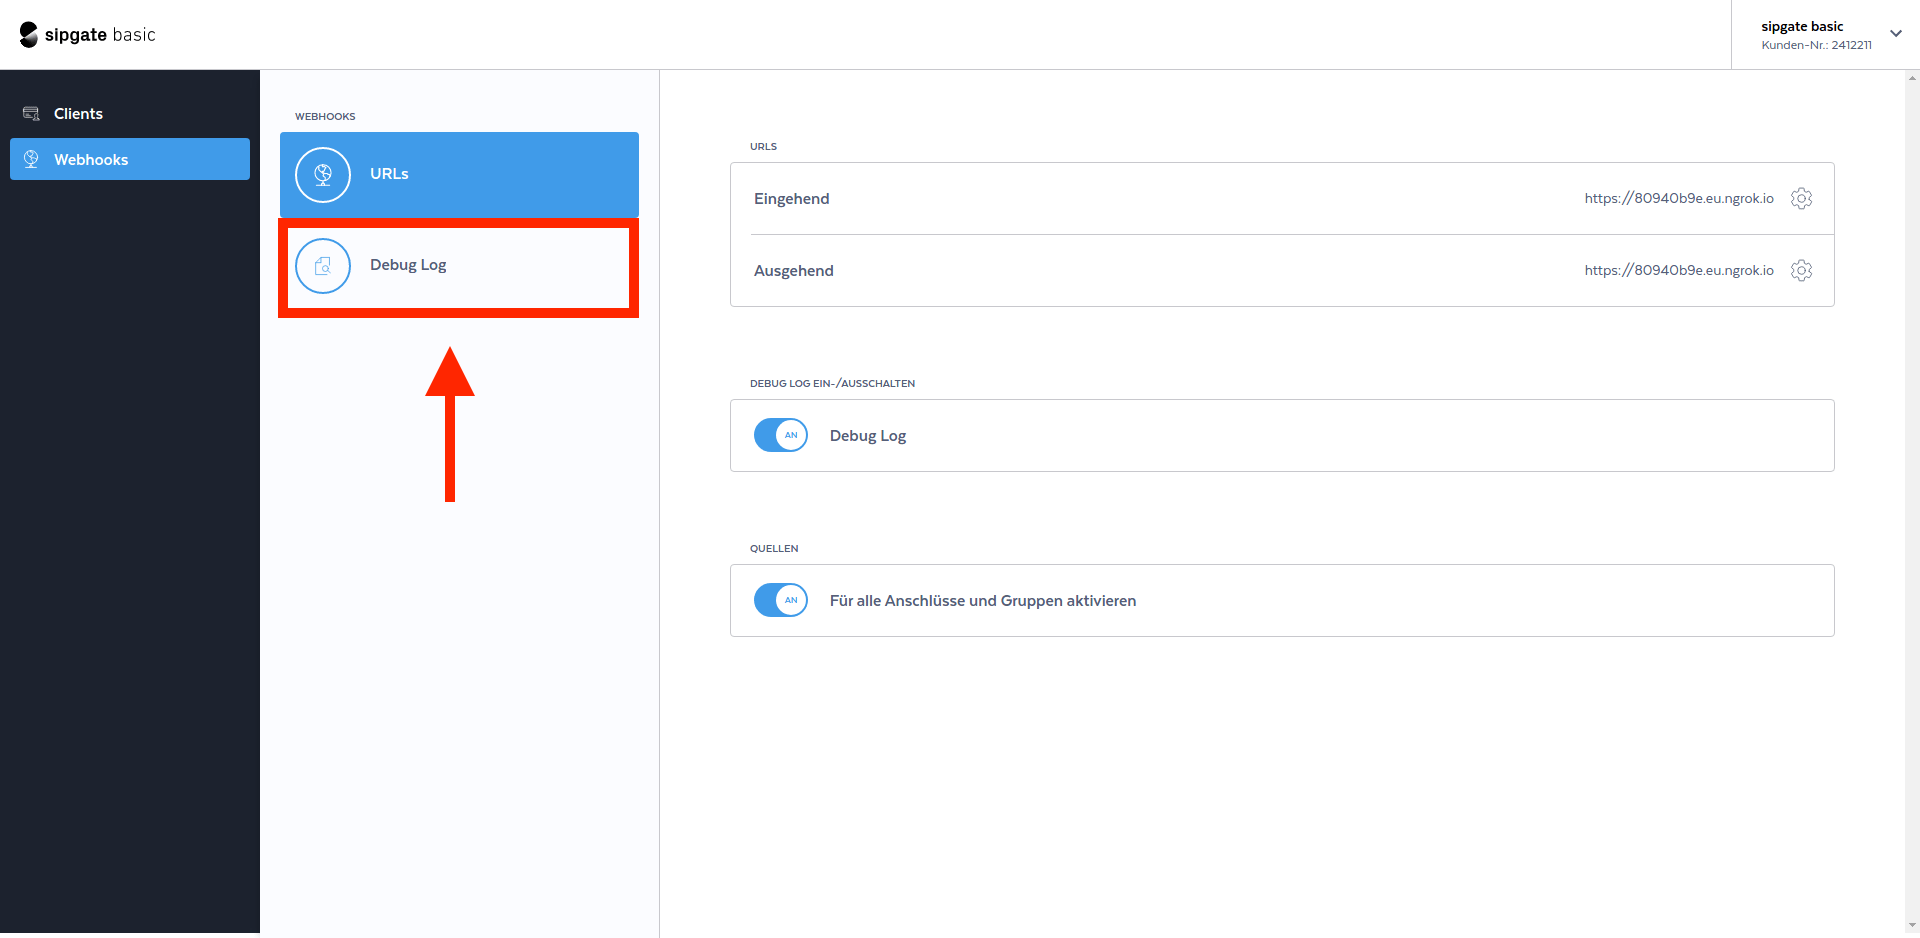
2. To view the logged requests, click on „Debug log“ in the menu on the left.
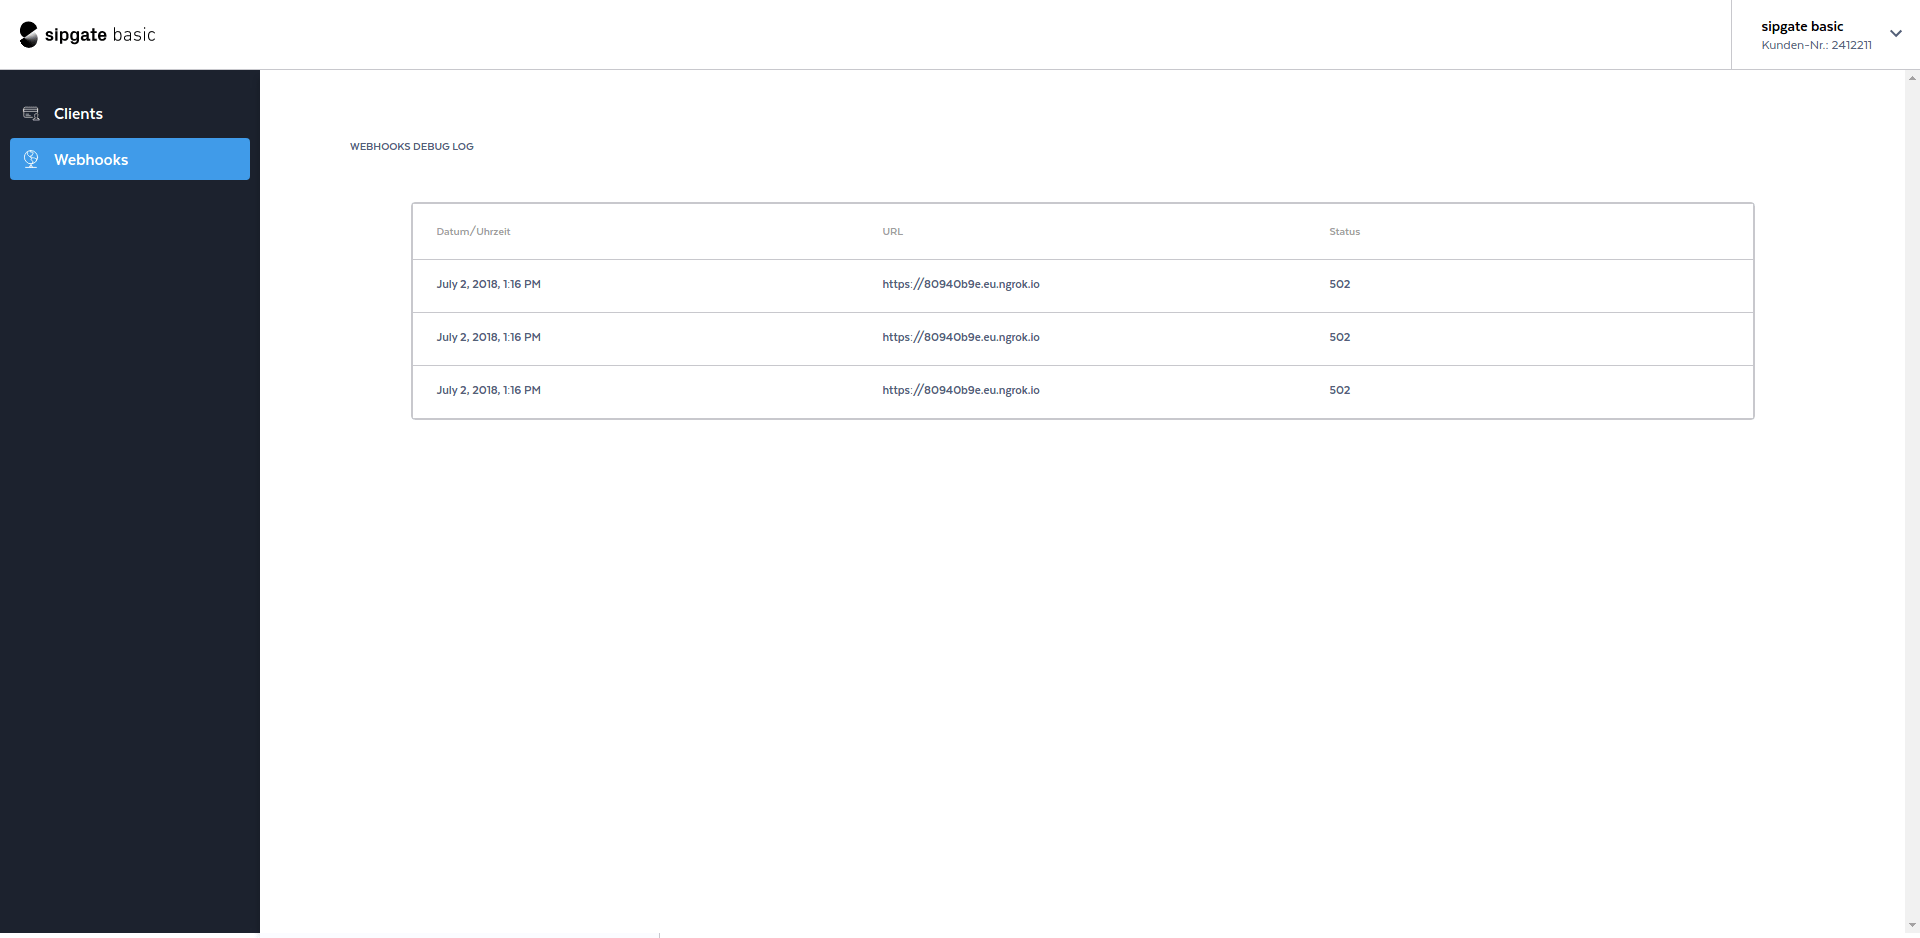
3. Your request should be logged and look like this.
Inspect incoming network traffic
You can use ngrep to inspect incoming requests
sudo ngrep -dany -Wbyline port 3000
The output should look like this
###
T 10.42.42.42:42528 -> 10.42.42.23:3000 [AP]
POST / HTTP/1.1.
Accept: application/xml, text/plain, text/html.
Accept-Charset: utf-8.
User-Agent: sipgate.io.
X-SIPGATE-JOBS: http://www.sipgate.de/jobs.
Content-Length: 84.
Content-Type: application/x-www-form-urlencoded; charset=UTF-8.
Accept-Encoding: gzip,deflate.
Host: gwen.fuglu.net:3000.
Via: 1.1 localhost (squid/3.1.20).
X-Forwarded-For: 217.10.77.113.
Cache-Control: max-age=259200.
Connection: keep-alive.
.

##
T 10.42.42.42:42528 -> 10.42.42.23:3000 [AP]
event=newCall&direction=in&from=anonymous&to=445603000514&callId=4932215337270853042
##
T 10.42.42.23:3000 -> 10.42.42.42:42528 [AP]
HTTP/1.1 200 OK.
X-Powered-By: Express.
Content-Type: application/xml; charset=utf-8.
Content-Length: 46.
Date: Tue, 23 May 2017 11:27:11 GMT.
Connection: keep-alive.
.
<Response><Dial><Voicemail/></Dial></Response>
#