
- What is sipgate.io?
- In this tutorial
- Before we begin
- Setting up a project
- Webhook server
- Statistics
- Creating the dashboard with Chart.js
- Serving the frontend
- Setting up websocket communication
- Bringing it all together
What is sipgate.io?
sipgate.io is a collection of APIs, which enables sipgate’s customers to build flexible integrations matching their individual needs.
Among other things, it provides interfaces for sending and receiving text messages and faxes, monitoring the call history, as well as initiating and manipulating calls.
The webhook capability of sipgate.io allows for the real-time processing of call data and implementation of applications like IVRs (interactive voice recordings).
In this tutorial
We will focus on the webhook functionality and use it to obtain some statistics about incoming phone calls.
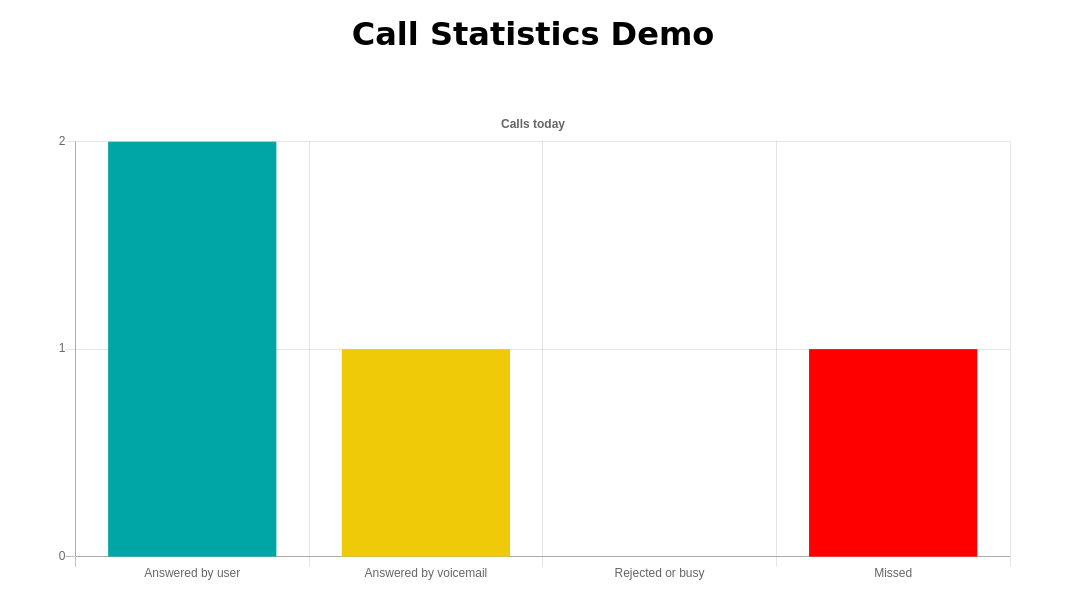
The application we will be building is a simple dashboard interface that displays the number of calls that have been
- totalAnswered by a user
- totalAnswered by the voicemail
- rejected (or user was busy)
- missed
in a nice bar graph.
For this graph we will be using the JavaScript library Chart.js.
In order to update the data in real-time we will connect frontend and backend via a websocket using the socket.io library.
Before we begin
Before we dive into the code, let’s quickly set up your sipgate account for sipgate.io.
For infos on how to do that, check out www.sipgate.io/get-started
To activate webhooks for incoming and outgoing calls, go to console.sipgate.com and select „Webhooks“ from the sidebar on the left.
The „URLs“ tab lets you configure target URLs for these webhooks.
It distinguishes incoming and outgoing calls and also allows for the explicit selection of phonelines that should trigger webhooks.
By default all phonelines are activated.
For the purpose of this application we will only be using the „Incoming“ URL since we don’t want to gather statistics about outgoing calls.
It can be any publicly accessible URL on the web.
Local addresses like localhost or 127.0.0.1 and any other local network address will not work.
When using webhooks in production you will want to run your code on a proper webserver with a proper address.
However, for the purpose of development we recommend using a service that makes your local environment accessible via the internet.
That makes it much easier to rapidly test out your written code.
There are a various services that can be used to accomplish this.
Some examples are localhost.run or ngrok.
Either one supplies you with a public URL that you can paste to the sipgate.io console.
Just make sure that you forward the correct port (in this tutorial we’ll be using port 8080, more on that later) and that the provider that you choose offers secure connections through HTTPS.
Set up a project
Now that your sipgate account is all set up, it’s time to start coding.
For this project we will be using the official sipgate.io Node.js library.
It makes working with sipgate’s APIs much easier and also provides a convenient way to set up a webhook server.
But first, let’s create a new Node project.
To do that, create a new directory that will hold our project and inside run npm init -y.
This creates a package.json file containing some meta data for the project.
Open it up and add
"scripts": {
  "start": "node src/server.js"
}
inside the outer curly braces to register a start script that can later be called from the command line.
Now, to install the sipgate.io Node library run npm install -S sipgateio.
That’s it for now.
We will come back and install some more dependencies later.
Webhook server
Let’s get coding!
Create a new file in a src folder with the name server.js.
The following snippet creates an instance of sipgate.io’s webhook module and uses that to create a webhook server that will be listening on webhookServerPort.
In order to handle follow-up events like the hangup we are after, the webhook server needs its own address, so we also pass webhookServerAddress.
Since that address can vary (especially when using your local machine with an SSH tunnel as with ngrok & Co) it may be a good idea to read it from an environment variable.
const { createWebhookModule } = require("sipgateio");

const webhookServerPort = 8080;
const webhookServerAddress =
  process.env.SIPGATE_WEBHOOK_SERVER_ADDRESS || "YOUR_WEBHOOK_SERVER_ADDRESS";

const webhookModule = createWebhookModule();

webhookModule.createServer({
  port: webhookServerPort,
  serverAddress: webhookServerAddress,
});
The createServer function returns a promise of a WebhookServer which can then be used to register callback functions for various call events:
webhookModule
  .createServer({
    port: webhookServerPort,
    serverAddress: webhookServerAddress,
  })
  .then((webhookServer) => {
    console.log(
      `Server running at ${webhookServerAddress}\n` + "Ready for calls ?"
    );
    webhookServer.onNewCall(logCall);
  });
For newCall events logCall just prints a readable representation of the call to the console.
const logCall = (newCallEvent) => {
  console.log(`New Call from ${newCallEvent.from} to ${newCallEvent.to}`);
};
Now it’s time for a test drive!
Start up the server with npm start and wait for the message on the console saying that the server is running.
Make sure that it displays the correct server address, then call your sipgate number.
You should now see the log of the newCall event.
Statistics
Our goal was to gather some statistics about different call scenarios.
These different scenarios are distinguishable by different kinds of hangUp events.
To get these events from the sipgate.io webhook API, let’s register a callback function for those as well:
webhookModule
  .createServer({
    port: webhookServerPort,
    serverAddress: webhookServerAddress,
  })
  .then((webhookServer) => {
    console.log(
      `Server running at ${webhookServerAddress}\n` + "Ready for calls ?"
    );
    webhookServer.onNewCall(logCall);
    webhookServer.onHangUp(handleHangUpEvent);
  });
For hangUp events handleHangUpEvent manipulates a counter object counters defined as
const counters = {
  totalAnswered: 0,
  voicemail: 0,
  canceled: 0,
  busy: 0,
};
Since we are interested in why calls have been hung up we keep track of those different causes.
The cause normalClearing represents the case that a call has been answered and subsequently hung up by either party.
This can mean either of two things: the call was answered by a person, or it has been answered by the voicemail.
To distinguish these two cases we also count the cause forwarded which indicates a redirect to voicemail.
The cause cancel indicates a missed call, i.e. the caller hung up before someone answered.
busy means that either the person that was being called was already on the phone with someone else or decided to reject the call.
const handleHangUpEvent = (hangUpEvent) => {
  if (hangUpEvent.cause === "normalClearing") {
    counters.totalAnswered += 1;
  }

  if (hangUpEvent.cause === "forwarded") {
    counters.voicemail += 1;
    return;
  }

  if (hangUpEvent.cause === "cancel") {
    counters.canceled += 1;
  }

  if (hangUpEvent.cause === "busy") {
    counters.busy += 1;
  }
};
Note: The counters object is just in memory.
A restart of the server causes the data to be reset.
To persist it you’d have to save the data to a database or file, but for the sake of the tutorial we’ll stick to the in-memory solution.
At this point you might have realized that the data in the counters object is not exactly what we want to display:
First we have to separate the number of calls answered by a user from those answered by the voicemail.
This is done in the function calculateData:
const calculateData = () => {
  const answeredByUser = counters.totalAnswered - counters.voicemail;
  return [answeredByUser, counters.voicemail, counters.busy, counters.canceled];
};
It returns the data as an array which – while not very elegant – will come in handy when working with Chart.js in the frontend.
Creating the dashboard with Chart.js
Now, that we’ve collected the statistics we can focus on visualizing them.
For that we’ll create a minimal website with a bar chart using the Chart.js library.
To follow along, create an index.html with the following contents:
<!-- index.html -->

<html lang="en">
  <head>
    <link rel="stylesheet" href="/style.css" />

    <!-- Load the Chart.js code from a CDN -->
    <script src="https://cdn.jsdelivr.net/npm/chart.js@2.9.3/dist/Chart.min.js"></script>

    <title>Call Statistics Demo</title>
  </head>
  <body>
    <header><h1>Call Statistics Demo</h1></header>
    <section class="statistics">
      <!-- We'll tell Chart.js to render the graph in this canvas -->
      <canvas id="chart"></canvas>
    </section>
    <script src="/script.js"></script>
  </body>
</html>
As you surely noticed, we didn’t create the script.js file, yet.
So let’s do that now.
// script.js

const setupChart = (data) => {
  const context = document.getElementById("chart").getContext("2d");

  return new Chart(context, {
    type: "bar",
    data: {
      labels: data.labels,
      datasets: [
        {
          data: data.data,
          backgroundColor: [
            colors.cyan,
            colors.yellow,
            colors.orange,
            colors.red,
          ],
          borderWidth: 0,
        },
      ],
    },
    options: {
      legend: { display: false },
      tooltip: { position: "average" },
      title: { display: true, text: "Calls today" },
      scales: {
        yAxes: [
          {
            ticks: {
              beginAtZero: true,
              stepSize: 1,
            },
          },
        ],
      },
    },
  });
};
At first glance, there’s a lot going on in this method.
Let’s break it down into individual chunks.
The colors object is just a collection of colors for use in our chart.
const colors = {
  cyan: "#00A6A6",
  yellow: "#EFCA08",
  orange: "#F49F0A",
  red: "#FF0000",
};
In our setup method we first need to get a reference to the 2D canvas context:
const context = document.getElementById("chart").getContext("2d");
Next, we’ll create a new bar chart using the Chart.js library.
We’re passing the 2D context into the Chart.js constructor as the first parameter.
The second parameter is an object specifying the chart’s data, as well as the styling and behavior.
The setupChart method accepts a single parameter with the following structure.
{
    labels: [], // Array of labels, one for each value
    data: [] // Array of values (numbers)
}
This structure makes it easy to integrate the data into our chart.
data: {
    labels: data.labels,
    datasets: [{
        data: data.data,
        backgroundColor: [colors.cyan, colors.yellow, colors.orange, colors.red],
        borderWidth: 0,
    }],
},
Chart.js supports multiple datasets, that a user can switch between.
For our use case, we’ll only create one, using the provided data and the colors defined earlier.
An explanation for the values passed into the options attribute can be found in the Chart.js docs.
Serving the frontend
In this step, we’ll create a simple express web server to serve the static files of our application (index.html, script.js, …).
Install express with npm install -S express.
Next, add the following lines to the server.js file.
// server.js

const path = require("path");
const express = require("express");

const app = express();

app.use(express.static(path.resolve(__dirname, "../public")));

app.get("/", (_, res) => {
  res.sendFile(path.resolve(__dirname, "../public/index.html"));
});

const server = app.listen(3000);
app.use(express.static() … registers a middleware to serve all files located in our public directory, while app.get(‚/‘, … registers a callback function that is called when a client visits the / route.
This function will then return our index.html file.
Setting up websocket communication
To send data from our backend, we’ll build a websocket connection using socket.io.
First, we’re going to install socket.io npm install -S socket.io and set up a web socket server in our server.js.
// server.js

const socketIo = require("socket.io");

const websocketServer = socketIo(server, {
  serveClient: true,
  origins: "*:*",
});
Next, we need to setup a connection handler, that will send data to newly connected clients.
// server.js

websocketServer.on("connection", (socket) => {
  socket.emit("init", {
    labels: [
      "Answered by user",
      "Answered by voicemail",
      "Rejected or busy",
      "Missed",
    ],
    data: calculateData(),
  });
});
We’re including a labels array, to be able to correctly label our chart in the browser.
Now, every time a hangup event arrives, we need to send a message to all connected clients.
For that, we’ll add the following line to our handleHangUpEvent method.
websocketServer.emit("data", calculateData());
Notice, that this time around, we’re not sending the labels, but only the data.
Bringing it all together
Add this line to your index.html file, to include socket.io.
<script src="/socket.io/socket.io.js"></script>
We can then define event handlers for the events, sent by our server.
//script.js
const socket = io("/");

let callChart;

socket.on("init", (data) => {
  callChart = setupChart(data);
});

socket.on("data", (data) => {
  updateChart(callChart, data);
});

const updateChart = (chart, data) => {
  chart.data.datasets[0].data = data;
  chart.update();
};

const setupChart = (data) => {
  // same as above
};
If you’ve followed along until now, congratulations! You should now have a working example using sipgate.io webhooks in combination with web sockets.
You can check out the whole project here: https://github.com/sipgate-io/io-labs-webhook-call-statistics
Keine Kommentare